Navigating success for our clients since 1996
info@compasscommercial.com
Property Mgmt. (541) 330-0025
Main (541) 383-2444
Compass Commercial Real Estate Services Bend OR
  • Search Our Listings
  • What We Offer
    • Brokerage
    • Asset & Property Management
    • Construction Services
    • Market Report
  • Our Team
  • About Us
  • Contact Us
  • Search Our Listings
  • What We Offer
    • Brokerage
    • Asset & Property Management
    • Construction Services
    • Market Report
  • Our Team
  • About Us
  • Contact Us

News

Home/Market Research/Compass Points Market Report/Compass Points Q2 2017 Market Survey
Compass Points Q2 2017_blog_main

Compass Points Q2 2017 Market Survey

by Compass Commercialon 24 July 2017in Compass Points Market Report

Compass Points Q2 2017 coverLast quarter we wrote about the Bend UGB expansion and how the different land-use zones fit into the big picture. One of those zones, IL (Light Industrial), is undergoing a big change on Bend’s west side, which will have significant impacts on values and use, both for residential and commercial applications.

Bend’s citywide office market recorded a negative net absorption of 1,406 sq. ft. during the quarter. The vacancy rate rose slightly, from 3.67% to 3.73% as a result. We now have 93,468 sq. ft. available for lease, up from 92,062 sq. ft. in Q1 2017. Even with this slight uptick, it still represents the second lowest office vacancy rate since Compass’ brokers began tracking vacancies in 1996.

In addition, the Bend retail market was represented by 253 retail buildings totaling nearly 4,450,000 square feet for the second quarter of 2017. The citywide vacancy rate fell once again, from 3.21% to 3.15% at the end of Q2 due to a total of 2,711 sq. ft. of positive absorption.

Compass Points Q2 Data Snapshot

Click the image to see the full infographic.

The industrial market in Bend gained another 51,700 sq. ft. of positive net absorption in Q2, however, due to an addition of 70,000 sq. ft. building in the northeast submarket, the results show an increased vacancy rate, from Q1’s 4.63% to 4.99% in Q2. Without the addition of the new structure, the absorption would have been a net negative 18,300 sq. ft.

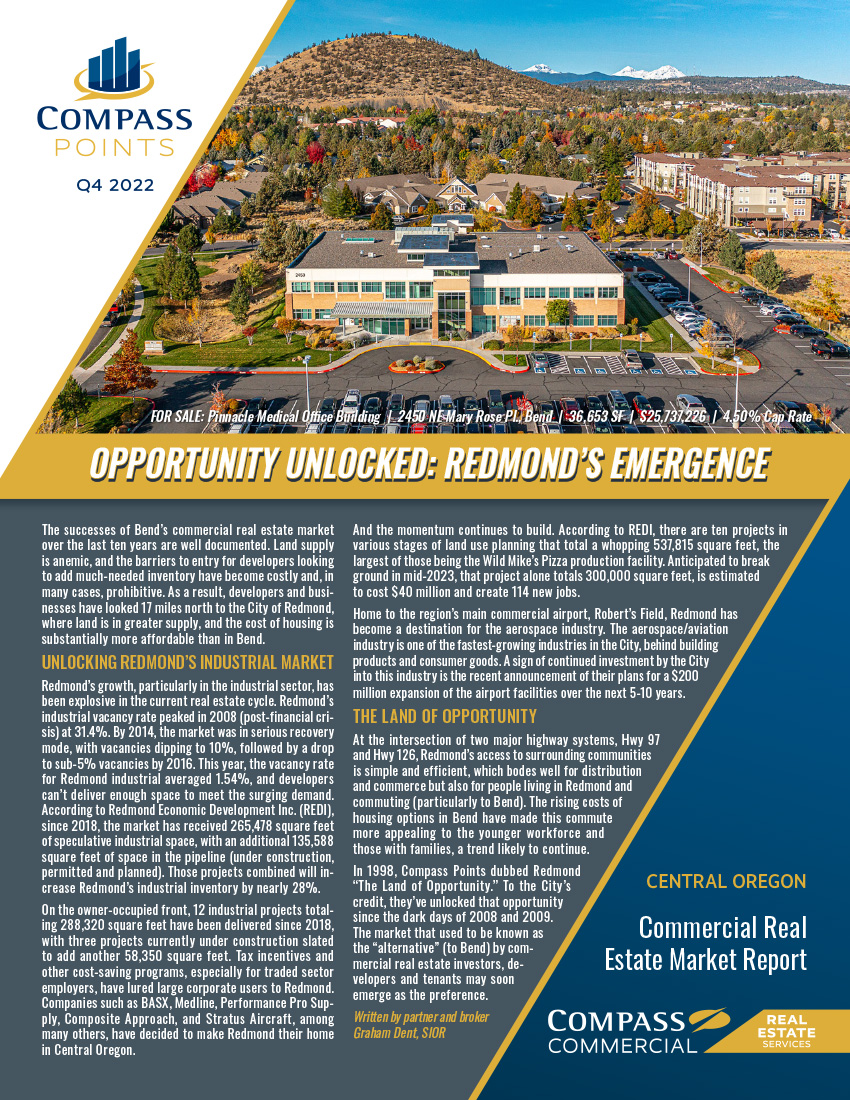
For the first time since the second quarter of 2014, the vacancy rate rose in Redmond’s 1.52 million square foot, 78 building industrial market.

To view the complete report and receive the quarterly publication, sign up at https://www.compasscommercial.com/POINTS or call (541) 383-2444.

Share this article
0
0
0
previous article

Central Oregon CRE Update – June Transactions

next article

Commercial Real Estate Outlook

Categories

  • Advisor Insights
    • Dan Kemp, CCIM
    • Howard Friedman CCIM
    • Jay Lyons, SIOR, CCIM
    • KBND Interviews
    • Pat Kesgard, CCIM
    • Peter May, CCIM
    • Ron Ross, CCIM
    • Steve Toomey, CCIM
  • Client Solutions/Case Studies
    • Business Sales
    • Construction Services
    • Property Management
    • Retail & Restaurants
    • Sales/Leasing
  • Compass Commercial News
    • Awards & Lists
    • Compass Cares
    • Press Releases
      • Business Sales
    • Transaction News
  • CRE Industry
  • Helpful Resources & Links
    • Community Resources
    • FAQ: Common CRE Questions
  • Investing in CRE
  • Local Economy & Community
    • Economic Development
  • Market Research
    • Central Oregon Multifamily News
    • Compass Points Market Report
  • Op Ed
  • Uncategorized

Get In Touch

  • 600 SW Columbia St., Suite 6100 Bend, OR 97702
  • 541-383-2444
  • info@compasscommercial.com
  • www.compasscommercial.com

Leave a Review

What We Offer

Services

Brokerage

Asset & Property Management

Construction Services

Featured Properties

Our Company

About Compass

Experience

Compass Cares

Our Team

Join the Team

Learn More

Market Report

CRE Resources

Press Releases

Client Stories

Construction Portfolio

Why Central Oregon

© Copyright 2020 Compass Commercial. Digital Marketing Agency Credit.

Signup for News & Listing Alerts   |    Contact Us   |    (541) 383-2444