Navigating success for our clients since 1996
info@compasscommercial.com
Property Mgmt. (541) 330-0025
Main (541) 383-2444
Compass Commercial Real Estate Services Bend OR
  • Search Our Listings
  • What We Offer
    • Brokerage
    • Asset & Property Management
    • Construction Services
    • Market Report
  • Our Team
  • About Us
  • Contact Us
  • Search Our Listings
  • What We Offer
    • Brokerage
    • Asset & Property Management
    • Construction Services
    • Market Report
  • Our Team
  • About Us
  • Contact Us

Tag : market data

Home/
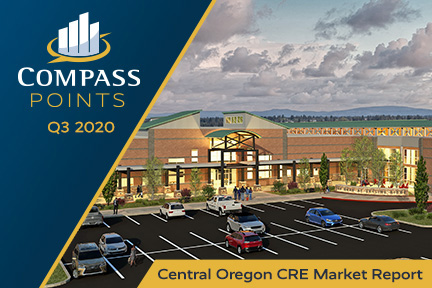
Compass Points Q3 2020

Compass Points Q3 2020 Market Report

by Lauren Evanson 21 October 2020in Compass Points Market Report

Compass Points Q2 2020Growth and New Construction in Central Oregon:

The 2020 COVID-19 crisis caused businesses to pivot how they are operating. Those who were hit the hardest have been unable to keep their doors open. However, the Central Oregon commercial market is remaining strong with new construction popping up all over the area. What is causing this influx in demand for commercial properties? Find out in the Q3 Market Report.

Bend’s Office Market:

Compass Commercial surveyed 218 office buildings for the third quarter 2020 Bend report. The buildings in the sample totaled 2,731,655 square feet (SF). Negative net absorption of 20,557 SF was recorded during the quarter, and the vacancy rate rose to 7.50%, up from 5.48% in Q2 2020. There is now 204,963 SF available for lease, up from 145,601 SF in Q2. Get the full report for a complete breakdown of the Bend office market.

Bend’s Retail Market:

Compass Commercial surveyed 260 retail buildings totaling nearly 4,523,652 square feet (SF) for the third quarter of 2020. The citywide vacancy rate rose slightly, from 3.09% at the end of Q2 2020 to 3.38% at the end of Q3. There is currently 152,798 SF of retail space available citywide, up from 139,843 SF in Q2. Get the full report for a complete breakdown of the Bend retail market.

Bend and Redmond Industrial Markets:

Compass Commercial surveyed 320 industrial buildings for the third quarter 2020 report, totaling 4,612,306 square feet (SF). The industrial market gained a healthy 53,008 SF of net positive absorption in Q3, and the vacancy rate dropped from 3.80% in Q2 to 3.47% in Q3 2020. Four new buildings were added to the survey in Q3 and there is now 159,856 SF of industrial space available for lease in Bend, compared to 170,716 SF in Q2.

The Redmond Industrial market experienced 23,063 square feet (SF) of negative net absorption in the third quarter of 2020 with two new leases and five new vacancies noted. The vacancy rate rose to 3.50%, up from 2.10% in Q2. Out of Redmond’s industrial sector of 1,654,385 SF total leasable space, there is now 58,447 SF available for lease. There are 87 buildings in the Redmond industrial market that were surveyed.

To view the complete report, sign up to receive our quarterly publication at https://www.compasscommercial.com/POINTS or call (541) 383-2444.

Compass Points is a quarterly publication of Compass Commercial Real Estate Services offering comprehensive surveys of the Central Oregon commercial real estate market. The report provides a detailed look at quarterly vacancy and absorption data in office, retail and industrial product types throughout Bend’s primary submarkets, as well as the Redmond industrial market. Absorption data contained in the report pulls from samples of buildings over 3,000 sq. ft.

Read More
Compass Points Q2 2020

Compass Points Q2 2020 Market Report

by Compass Commercialon 22 July 2020in Compass Points Market Report

Compass Points Q2 2020The Effects of COVID-19 on Commercial Real Estate:

It comes as no surprise COVID-19 has made an impact on the world. The last five months have changed dramatically for tenants and landlords alike. Brokers Howard Friedman, CCIM, Ron Ross, CCIM and Graham Dent, Partner take a look at how each market has been affected and what has stayed the same. Plus, get a sneak peek into the multifamily market.

Bend’s Office Market:

Compass Commercial surveyed 212 office buildings for the second quarter 2020 Bend report. The buildings in the sample totaled 2,658,027 square feet (SF). A negative net absorption of 29,175 SF was recorded during the quarter with a vacancy rate of 5.48%, up from 4.11% in Q1 2020. There is now 145,601 SF available for lease, up from 108,367 SF in Q1. Get the full report for a complete breakdown of the Bend office market.

Bend’s Retail Market:

Compass Commercial surveyed 259 retail buildings totaling nearly 4,519,289 square feet (SF) for the second quarter of 2020. The citywide vacancy rate rose slightly, from 3.01% at the end of Q1 2020 to 3.09% at the end of Q2. There is currently 139,843 SF of retail space available citywide, up from 135,866 SF in Q1. Get the full report for a complete breakdown of the Bend retail market.

Bend and Redmond Industrial Markets:

Compass Commercial surveyed 316 industrial buildings for the second quarter 2020 report, totaling 4,493,791 square feet (SF). The industrial market lost 12,277 SF of net negative absorption in Q2, and the vacancy rate rose from 3.27% in Q1 to 3.80% in Q2 2020. There is now 170,716 SF of industrial space available for lease in Bend, compared to 146,439 SF in Q1.

The Redmond Industrial market gained 10,225 square feet (SF) of positive net absorption in the second quarter of 2020 for a fourth straight gain in quarterly occupancy, with three new leases noted. The vacancy rate rose slightly however, from 1.7% to 2.1%, due to an additional 17,206 SF building on NE 11th Street being added to the survey. Out of Redmond’s industrial sector of 1,654,385 SF total leasable space, there is now just 35,384 SF available for lease.

To view the complete report, sign up to receive our quarterly publication at https://www.compasscommercial.com/POINTS or call (541) 383-2444.

Compass Points is a quarterly publication of Compass Commercial Real Estate Services offering comprehensive surveys of the Central Oregon commercial real estate market. The report provides a detailed look at quarterly vacancy and absorption data in office, retail and industrial product types throughout Bend’s primary submarkets, as well as the Redmond industrial market. Absorption data contained in the report pulls from samples of buildings over 3,000 sq. ft.

Read More
Compass Points Q1 2020

Compass Points Q1 2020 Market Report

by Compass Commercialon 21 April 2020in Compass Points Market Report

Compass Points Q1 2020Tenants, Landlords & COVID-19:

Covid-19 took the world by complete surprise. Partner and Broker Dan Kemp, CCIM breaks down the effects the virus has on businesses, landlords and tenants in Central Oregon and what you can do to help.

Bend’s Office Market:

Compass Commercial brokers surveyed 210 buildings for the first quarter 2020 office report. The buildings in the sample totaled just over 2.636 million square feet (SF). Positive net absorption of 3,738 was recorded during the quarter, but the vacancy rate rose slightly, due to the addition of another office building to the survey, moving from 4.02% in Q4 ’2019 to 4.11% in Q1 ‘20. There is now 108,367 SF available for lease, up from 105,218 SF in Q4.

Bend’s Retail Market:

Compass Commercial surveyed 257 retail buildings totaling over 4.5 million square feet (SF) for the first quarter of 2020. The citywide vacancy rate rose slightly, after three quarters of gain, from 2.9% at the end of Q4 ‘19 to 3.01% at the end of Q1 ’20. There is currently 135,866 SF of retail space available city-wide, up from 130,743 SF in Q4.

Bend and Redmond Industrial Markets:

Compass Commercial surveyed 315 buildings for the first quarter 2020 industrial report, totaling 4,479,864 square feet (SF). The industrial market took a big hit in the quarter, losing 77,176 SF of net negative absorption in Q1, and the vacancy rate rose from 1.55% in Q4 to 3.27% in Q1, the first time the vacancy rate has been above 3% since Q4 of 2017. There is now 146,439 SF of industrial space available for lease in Bend, compared to 69,263 SF in Q4.

The Redmond industrial market gained 2,000 square feet (SF) of positive net absorption in the first quarter of 2020 for a third straight gain in quarterly occupancy, with just one new lease noted. The vacancy rate fell as a result, from 1.9% to just 1.7%. Out of Redmond’s industrial sector of 1,637,179 SF total leasable space, there is now just 28,403 SF available for lease.

To view the complete report, sign up to receive our quarterly publication at https://www.compasscommercial.com/POINTS or call (541) 383-2444.

Compass Points® is a quarterly publication of Compass Commercial Real Estate Services offering comprehensive surveys of the Central Oregon commercial real estate market. The report provides a detailed look at quarterly vacancy and absorption data in office, retail and industrial product types throughout Bend’s primary submarkets, as well as the Redmond industrial market. Absorption data contained in the report pulls from samples of buildings over 3,000 sq. ft.

Read More
Spring 2020 MF

CO MULTIFAMILY NEWS: Investing Lessons

by Compass Commercialon 27 February 2020in Central Oregon Multifamily News

By Ron Ross, CCIM

As you likely know, Warren Buffett, the CEO of Berkshire Hathaway, made his considerable fortune investing in the stock market. Mr. Buffett has also done well investing in real estate and many of his stock market principals carry over to real estate investing.

So what did Mr. Buffett learn from his real estate investments?

  1. Buy when most are selling and sell when most are buying. Mr. Buffett once said, “I will tell you how to become wealthy. Be fearful when others are greedy. Be greedy when others are fearful.” Restated, buy when most are selling and sell when most are buying.
  2. Don’t concern yourself about daily valuations. Warren Buffett bought properties at bargain prices and knew that over time, they would make good investments. “Games are won by players who focus on the playing field,” he quipped, “not by those whose eyes are glued to the scoreboard.” As he likes to say, “our favorite holding period is forever.”
  3. Property management is often undervalued and underappreciated. You don’t need to be a real estate expert to achieve satisfactory returns, but you do need to turn over management to someone who is well qualified to manage the property for you.

Thanks to Doug Marshall for contributing these Warren Buffett nuggets. Doug Marshall is the award-winning author of Mastering the Art of Commercial Real Estate Investing, and a multifamily mortgage broker with Marshall Commercial Funding. If you need advice on multifamily financing, Doug can be reached at 503-614-1808 or check out his website at marshallcf.com.

The Central Oregon multifamily market remains robust. Vacancy rates are steady and 2019 had modest rent growth.

Very few owners are selling and there is heavy buyer demand. Is this a market being driven by fear or greed?

If selling your multifamily property is on your horizon, now is a great time to call us at 541.322.1230 or 541.848.4060.

The Central Oregon Multifamily News is published by brokers Ron Ross, CCIM and Terry O’Neil, CCIM.

To find out about new multifamily listings, sign up for new listing alerts by going to: compasscommercial.com/mfnews.

Click here to view the full PDF Newsletter.

Read More
Compass Points Q4 2019

Compass Points® Q4 2019 Market Report

by Compass Commercialon 20 January 2020in Compass Points Market Report

Compass Points Q3 20192019 Summary / 2020 Forecast:

In this issue’s cover article, principal broker and partner Howard Friedman, CCIM reviews the year in commercial real estate and makes predictions for 2020.

Bend’s Office Market:

Compass Commercial surveyed 209 buildings for the fourth quarter 2019 office report. The buildings in the sample totaled just over 2.61 million square feet. Positive net absorption of 11,005 sq. ft. was recorded during the quarter, but the vacancy rate rose slightly, due to the addition of a large office building to the survey, moving from 3.93% in Q3 to 4.02% in Q4.

Bend’s Retail Market:

Compass Commercial surveyed 256 retail buildings totaling 4.5 million square feet for the fourth quarter of 2019. The citywide vacancy rate fell once again for the third quarter in a row, from 3.3% at the end of Q3 2019 to 2.94% at the end of the year.

Bend and Redmond Industrial Markets:

Compass Commercial surveyed 315 buildings for the fourth quarter 2019 industrial report, totaling 4,477,864 square feet. The industrial market gained 791 sq. ft. of net positive absorption in Q4, and the vacancy rate fell slightly from 1.58% in Q3 to 1.55% in Q4. There is now 69,263 sq. ft. of industrial space available for lease in Bend, compared to 70,054 sq. ft. in Q3.

The Redmond Industrial market gained 31,123 square feet of positive net absorption in the fourth quarter of 2019 for a second straight gain in occupancy. The vacancy rate fell as a result, from 3.8% to just 1.9%. Out of Redmond’s industrial sector of 1,637,179 sq. ft. total leasable space, there is now just 30,403 sq. ft. available for lease.

To view the complete report, sign up to receive our quarterly publication at https://www.compasscommercial.com/POINTS or call (541) 383-2444.

Compass Points® is a quarterly publication of Compass Commercial Real Estate Services offering comprehensive surveys of the Central Oregon commercial real estate market. The report provides a detailed look at quarterly vacancy and absorption data in office, retail and industrial product types throughout Bend’s primary submarkets, as well as the Redmond industrial market. Absorption data contained in the report pulls from samples of buildings over 3,000 sq. ft.

Read More
Compass Points Q3 2019

Compass Points® Q3 2019 Market Survey

by Compass Commercialon 28 October 2019in Compass Points Market Report

Compass Points Q3 2019A Look Into Our Economic Future:

In this issue’s cover article, principal broker and partner Howard Friedman, CCIM discusses the economic future and how it affects the real estate industry.

Bend’s Office Market:

Compass Commercial surveyed 208 buildings for the third quarter 2019 office report. The buildings in the sample totaled just over 2.6 million square feet. Negative net absorption of 23,431 sq. ft. was recorded during the quarter moving the vacancy rate up to 3.9% from 2.98% in Q2. There is now 102,360 sq. ft. available for lease, up from 77,257 sq. ft. in Q2.

Bend’s Retail Market:

Compass Commercial surveyed 256 retail buildings totaling 4,503,899 square feet for the third quarter of 2019. The citywide vacancy rate fell dramatically from 5.39% at the end of Q2 2019 to 3.30% at the end of Q3. This was primarily due to a significant lease signed during the quarter in the north97 submarket.

Bend and Redmond Industrial Markets:

In Bend, we surveyed 314 buildings for the third quarter 2019 industrial report, totaling 4,427,296 square feet. The industrial market gained 34,051 sq. ft. of positive absorption in Q3, and the vacancy rate fell from 2.71% in A2 to just 1.58%. There is now 70,054 sq. ft. of industrial space available in Bend, compared to 119,105 sq. ft. in Q2.

In Redmond, the market gained back some of the losses incurred in the second quarter, with 14,500 sq. ft. of positive net absorption recorded in the third quarter of 2019. The vacancy rate fell from 4.6% to 3.8%. Redmond’s industrial sector now has 1,637,179 sq. ft. of total leasable space, now including owner occupied buildings and buildings under 3,000 sq. ft.

To view the complete report, sign up to receive our quarterly publication at https://www.compasscommercial.com/POINTS or call (541) 383-2444.

Compass Points® is a quarterly publication of Compass Commercial Real Estate Services offering comprehensive surveys of the Central Oregon commercial real estate market. The report provides a detailed look at quarterly vacancy and absorption data in office, retail and industrial product types throughout Bend’s primary submarkets, as well as the Redmond industrial market. Absorption data contained in the report pulls from samples of buildings over 3,000 sq. ft.

Read More
Compass Points Q2 2019

Compass Points® Q2 2019 Market Survey

by Compass Commercialon 25 July 2019in Compass Points Market Report

Compass Points Q2 2019A Primer on Restaurant Buying:

In this issue’s cover article principal broker and former restaurateur Howard Friedman shares tips on what it takes to purchase and operate a successful restaurant.

Bend’s Office Market:

Compass Commercial surveyed 207 buildings for the second quarter 2019 office report. The buildings in the sample totaled just under 2.6 million square feet. Negative net absorption of 2,396 sq. ft. was recorded during the quarter. Despite the negative absorption, the vacancy rate moved down to 2.98% from 3.03% in Q1, due to an additional building added to the survey. There is now 77,257 sq. ft. available for lease, down from 77,902 sq. ft. in Q1.

Bend’s Retail Market:

Compass Commercial surveyed 255 retail buildings totaling 4,492,794 square feet for the second quarter of 2019. The citywide vacancy rate rose significantly, from 2.84% at the end of Q1 2019 to 5.39% at the end of Q2. However, the majority of the vacancy was the direct result of the Shopko on Bend’s north end vacating its 106,216 sq. ft. store in April, due to bankruptcy of the company. In fact, removing that data point, the overall city wide vacancy rate would be just 3.0%, with only a 9,084 sq. ft. negative net number, rather than the 115,300 sq. ft. loss officially reported.

Bend and Redmond Industrial Markets:

In Bend we surveyed 313 buildings for the second quarter 2019 industrial report, totaling 4,392,452 square feet. The industrial market gained 30,018 sq. ft. of net absorption in Q2, and although the vacancy rate rose from 2.37% in Q1 to 2.71% presently, the change was due to two buildings being added to the survey. There is now 119,105 sq. ft. of industrial space available in Bend, compared to 103,104 sq. ft. in Q1.

In Redmond there was dramatic negative absorption in the second quarter, with the vacancy rate rising from 1.4% to 4.6%, due to 42,356 sq. ft. of negative net leasing and the addition of new buildings to the market. Redmond’s industrial sector now has 1,637,179 sq. ft. of total leasable space, not including owner occupied buildings and buildings under 3,000 sq. ft., with 76,026 sq. ft. available for lease in the 86 building industrial market.

To view the complete report, sign up to receive our quarterly publication at https://www.compasscommercial.com/POINTS or call (541) 383-2444.

Compass Points® is a quarterly publication of Compass Commercial Real Estate Services offering comprehensive surveys of the Central Oregon commercial real estate market. The report provides a detailed look at quarterly vacancy and absorption data in office, retail and industrial product types throughout Bend’s primary submarkets, as well as the Redmond industrial market. Absorption data contained in the report pulls from samples of buildings over 3,000 sq. ft.

Read More
Compass Points Q1 2019

Compass Points® Q1 2019 Market Survey

by Compass Commercialon 22 April 2019in Compass Points Market Report

Compass Points® Q1 2019

Navigating the Opportunity Zone

In this issue’s cover article broker Adam Bledsoe delves further into some commonly asked questions about the benefits of investing in Oregon’s opportunity zones. In recent months, the pace of conversation surrounding opportunity zones has accelerated, and as with any new tax law, questions lead to more questions.

Bend’s Office Market

Compass Commercial surveyed 206 buildings for the first quarter 2019 office report. The buildings in the sample totaled over 2.56 million square feet. Positive net absorption of 9,429 sq. ft. was recorded during the quarter. The vacancy rate moved to 3.03%, down from 3.4% in Q4 2018. There is now 77,902 sq. ft. available for lease, down from 87,331 sq. ft. in Q4.

Bend’s Retail Market

Compass Commercial surveyed 254 retail buildings totaling 4,472,142 square feet for the first quarter of 2019. The citywide vacancy rate rose slightly from 2.77% at the end of Q4 2018 to 2.84% at the end of Q1 2019. A total of 3,040 sq. ft. of negative net absorption took place.

Bend and Redmond Industrial Markets

In Bend we surveyed 311 buildings for the first quarter 2019 industrial report, totaling 4,344,396 square feet. The industrial market lost 18,600 sq. ft. of net absorption in Q1, for the second quarter in a row and the vacancy rate rose from Q4’s 1.72% to 2.4%, still a healthy vacancy rate. There is now 103,103 sq. ft. of industrial space available for lease in Bend, compared to 73,833 sq. ft. in Q4. Two of the four submarkets recorded negative net absorption, and two were positive.

In Redmond there was positive absorption in the Q1 Industrial market once again, with the vacancy rate lowering from 1.9% to 1.4%, due to 18,051 sq. ft. of net leasing. Redmond’s industrial sector now has 1,625,829 sq. ft. of total space, with just 22,620 sq. ft. available for lease in the 82 building industrial market.

To view the complete report, sign up to receive our quarterly publication at https://www.compasscommercial.com/POINTS or call (541)383-2444.

Compass Points® is a quarterly publication of Compass Commercial Real Estate Services offering comprehensive surveys of the Central Oregon commercial real estate market. The report provides a detailed look at quarterly vacancy and absorption data in office, retail and industrial product types throughout Bend’s primary submarkets, as well as the Redmond industrial market. Absorption data contained in the report pulls from samples of buildings over 3,000 sq. ft.

Read More
Cascade Village Shopping Center

Navigating Economic Trends Feature Article

by Compass Commercialon 20 March 2019in Howard Friedman CCIM

Cathy Carroll of the Bend Magazine wrote an article highlighting Compass Points®, the quarterly market report and broker Howard Friedman’s forecast for 2019. Here’s an excerpt from the article.

“As national media continues hailing Bend as one of the top places to live and work, Compass Commercial Real Estate Services wrapped up 2018 as its best year in the company’s twenty-year history. Factoring the current state of the economy, along with all indicators pointing to a strong commercial real estate market, they anticipate another great finish in 2019.

Market data from the national level and locally in Central Oregon tells a compelling story. Fourth-quarter economic reports from the U.S. Commerce Department revealed a 2017 growth rate of 2.6 percent, continuing one of the longest periods of economic expansion in U.S. history.

The Q4 2018 Compass Points® market report forecast was correct. ‘We’d predicted this trajectory would energize our ability to deliver the results you can expect from a team that has many professional accreditations, decades of experience and industry knowledge, and is dedicated to serving the needs of each client,’ said Howard Friedman, partner and the managing principal broker for Compass Commercial.”

To read the full article, click here.

Read More
Q4 2018 Compass Points

Compass Points® Q4 2018 Market Survey & Year Summary

by Compass Commercialon 28 January 2019in Compass Points Market Report

2018 SUMMARY / 2019 FORECAST

Cover Article By Howard Friedman, CCIM

It’s that time of year to take a look back at how we forecast the previous year. At the end of 2017 we delivered the following predictions:

“All the indicators we see point to another strong year in the commercial real estate market, both nationally and locally. Although 4th quarter economic reports from the Commerce Department recently announced a growth rate in 2017 of 2.6%, down from earlier predictions of 3.2%, it continued the trend of one of the longest periods of economic expansion in U.S. History. In short, Central Oregon is open for business in the commercial real estate market.”

Our prediction proved to be true. Compass Commercial had our best year ever, thanks to our valued clients. We foresee continued growth in Central Oregon in 2019, but are cautious beyond that, taking heed of global predictions beyond this year.

Summarizing the 2018 Market

Q4 2018 Compass Points 10 Yr. Vacancy RatesBend’s office market showed improvement in 2018. At the end of 2017, the vacancy rate stood at 3.61%, whereas at the end of 2018 it was 3.40%. Lease rates held fairly steady in the office market, with spaces being leased for $1.50–$2.00 per square foot per month triple net (NNN) for existing units (and depending on location and quality) and $2.00–$2.35 for newly built office space. The vacancy rate has now dropped eight years in a row in the office market, dating back to the end of 2010, when vacancies were 22.1% of the total market. At that time there was over 526,000 square feet of office space available for lease, while at the end of 2018 there was just over 87,000 sq. ft. available.

Retail vacancies in Bend also dropped from a rate of 2.8% at the end of 2017 to 2.77% at the end of 2018. Rental rates held strong again in 2018, with rents in the $1.50–$2.00 per sq. ft. NNN range and restaurants and new retail projects commanding $2.00–$2.75 or higher, in spite of many new projects coming out of the ground.

Bend’s overall industrial vacancy rate dropped again for the fifth year in a row, from 3.26% to an amazing 1.72%. Rental rates rose again to between $0.75 and $1.00 per sq. ft. per month NNN in 2018, with many flex buildings commanding rates much higher than that.

In Redmond, industrial vacancy rates dropped again for the seventh year in a row from 3.5% at the end of 2017 to just 1.9% at the close of 2018.

Supply vs. Demand

Q4 2018 Compass Points 10 Yr. Absorption RatesIn the office market 10,587 square feet of space was absorbed in 2018, compared with 71,783 sq. ft. 2017. There is now only 87,331 sq. ft. available out of a 2.57 million sq. ft. market. Absorption slowed in 2018, but remained in positive territory.

In the retail sector, 34,335 sq. ft. of positive net absorption was recorded in 2018. This compared with 2017’s total of just 1,939 sq. ft. of positive net absorption. There is presently 123,663 sq. ft. available in the Bend retail market, with a slew of new projects looking to open in the next two years.

The industrial market recorded another 105,215 sq. ft. of positive net absorption in 2018, compared with 135,377 sq. ft. in 2017. There is currently only 73,833 total sq. ft. available in the Bend industrial market. Using market absorption calculation methods, this represents just three quarters of supply available in the Bend industrial market. Several buildings are being constructed in the Carmen Lp./American Ln. area and are scheduled to come online in 2019, which should ease any strains on the industrial leasing market.

And in Redmond 30,808 sq. ft. of industrial space was absorbed in 2018, compared to 24,588 sq. ft. of positive absorption in 2017. There is currently 30,251 sq. ft. of industrial space available in the Redmond market, just a one-year supply at current absorption rates, compared to the end of 2017, when 54,559 sq. ft. was available for lease in Redmond.

What’s Ahead?

Although there has been talk of a slowing economy nationally, we predict that commercial real estate in Central Oregon will continue to be strong, with rents slowing in their increases, but values staying robust—at least for 2019. Cap rates should rise a bit due to the recent interest rate increases, but all in all, we see a bullish market ahead.

Office: Rental rates will remain strong as supply continues to be tight in Bend. This mirrors national trends as the economy continues its steady growth. High land prices locally continue to be a challenge for developers wanting to start new projects. Strong construction and labor costs continue in the area, with some companies pointing to tariffs contributing to steel and appliance price increases. This will continue to squeeze the office market’s supply. Projects like Crane Shed Commons and Deschutes Ridge Business Park saw successful leasing during 2018, and there are few new office projects on the books for 2019.

Retail: Central Oregon’s retail market continues its strong growth and low vacancies. Several projects we mentioned last year, including the former Ray’s west side redevelopment, are still in the start-up or planning stages and many redeveloped retail properties saw strong absorption in 2018. Although Shopko recently announced its Bend store will close due to its impending bankruptcy proceedings, and Deschutes Brewery’s recent layoffs (caused by a slowing craft beer industry) will affect our workforce, there is still a dearth of qualified workers in some trades, notably the restaurant business, where many ‘now hiring’ signs grace storefront windows in Central Oregon.

Industrial: Strong industrial rents and limited supply continue in the Bend and Redmond markets. New projects in both areas may hold off any supply panic in 2019, but if the economy slows as predicted in a few years, it may well be a blessing that we did not overbuild during these bullish years.

Multifamily: Central Oregon continues a strong building phase in the multifamily market. Many new projects have eased the housing crunch, but the affordability issue is still prevalent in our community. Local community leaders are aware of the problem and are attempting to ease the situation, but it does not come easy. Will Bend follow Portland’s lead and implement some sort of rent control to assist low-income renters in their quest for fair housing prices? Many in the area hope not, but something must be done to help our neighbors be able to live and work in our community without the fear of becoming homeless or displaced out of our growing region.

Howard Friedman is a partner and the managing principal broker for Compass Commercial. He was recently promoted to president of the board of directors and CEO of the Bethlehem Inn homeless shelter in Bend.

To view the complete report and receive the quarterly publication, sign up at https://www.compasscommercial.com/POINTS or call (541)383-2444.

Compass Points® is a quarterly publication of Compass Commercial Real Estate Services offering comprehensive surveys of the Central Oregon commercial real estate market. The report provides a detailed look at quarterly vacancy and absorption data in office, retail and industrial product types throughout Bend’s primary submarkets, as well as the Redmond industrial market. Absorption data contained in the report pulls from samples of buildings over 3,000 sq. ft.

Read More
  • 1
  • 2
  • 3
  • »

Categories

  • Advisor Insights
    • Dan Kemp, CCIM
    • Howard Friedman CCIM
    • Jay Lyons, SIOR, CCIM
    • KBND Interviews
    • Pat Kesgard, CCIM
    • Peter May, CCIM
    • Ron Ross, CCIM
    • Steve Toomey, CCIM
  • Client Solutions/Case Studies
    • Business Sales
    • Construction Services
    • Property Management
    • Retail & Restaurants
    • Sales/Leasing
  • Compass Commercial News
    • Awards & Lists
    • Compass Cares
    • Press Releases
      • Business Sales
    • Transaction News
  • CRE Industry
  • Helpful Resources & Links
    • Community Resources
    • FAQ: Common CRE Questions
  • Investing in CRE
  • Local Economy & Community
    • Economic Development
  • Market Research
    • Central Oregon Multifamily News
    • Compass Points Market Report
  • Op Ed
  • Uncategorized

Get In Touch

  • 600 SW Columbia St., Suite 6100 Bend, OR 97702
  • 541-383-2444
  • info@compasscommercial.com
  • www.compasscommercial.com

Leave a Review

What We Offer

Services

Brokerage

Asset & Property Management

Construction Services

Featured Properties

Our Company

About Compass

Experience

Compass Cares

Our Team

Join the Team

Learn More

Market Report

CRE Resources

Press Releases

Client Stories

Construction Portfolio

Why Central Oregon

© Copyright 2020 Compass Commercial. Digital Marketing Agency Credit.

Signup for News & Listing Alerts   |    Contact Us   |    (541) 383-2444