By the Compass Points Editorial Team
![]()
Since our last market update, Bend has experienced a few notable (and frequently debated) developments. On July 7, the the City of Bend announced the Urban Growth Boundary (UGB) Steering Committee’s approval of three expansion scenarios presented by the Boundary Tactical Advisory Committee (TAC) for further evaluation. The scenarios were whittled down from different areas based on the relative suitability for future growth and development. View the scenario maps and read about the proposed land uses at bendoregon.gov.
Q2 also marked the beginning of construction for OSU-Cascades’ four-year university campus. The 10-acre site on Bend’s west side comprises three new buildings including a residence hall that’s slated to house approximately 300 students. (There is now a live webcam of construction on the campus).
With these advances, you might surmise that Bend’s commercial real estate market would experience a continual decrease in vacancy, but our current data shows a fluctuation in the opposite direction. Q2 2015 data shows what may appear as a setback but our assessment is that this represents a typical market fluctuation as businesses expand and contract in a healthy market.
Citywide office vacancy rates increased from 8.9% to 9.2% with 6,600 sq. ft. of negative absorption reported. New vacancies included 14,000 sq. ft. in the RiverPoint One building at 1201 NW Wall St., Mosaic Medical vacating 12,000 sq. ft. at 409 NE Greenwood Ave. and 4,108 sq. ft. coming online at 705 SW Bonnett Way in the Mill Point Business Campus. The latter vacancy was the result of digital marketing company, Choose Growth expanding to occupy 9,507 sq. ft. at 20300 Empire Ave.
Bend’s citywide industrial vacancy increased from 6.63% to 7.8% with 22,800 sq. ft. coming online. The negative absorption was due in part by a 10,200 sq. ft. vacancy at 36 SE 9th St., a 7,500 sq. ft. vacancy at 62958 NE Layton Ave. and 9,900 sq. ft. at 350 SW Industrial Way.
Retail vacancy also witnessed a slight uptick. The citywide vacancy increased from 6.1% to 6.4% —a total of 14,500 sq. ft. of negative absorption — due in part by Coldwater Creek vacating 3,800 sq. ft. in the Old Mill District, downtown’s 3,321 sq. ft. vacancy at 1024 Bond St., Connecting Point vacating 6,978 sq. ft. on Franklin Ave. and 3,425 sq. ft. coming available in Westside Village at 155 SW Century Dr.
Bend Office Market
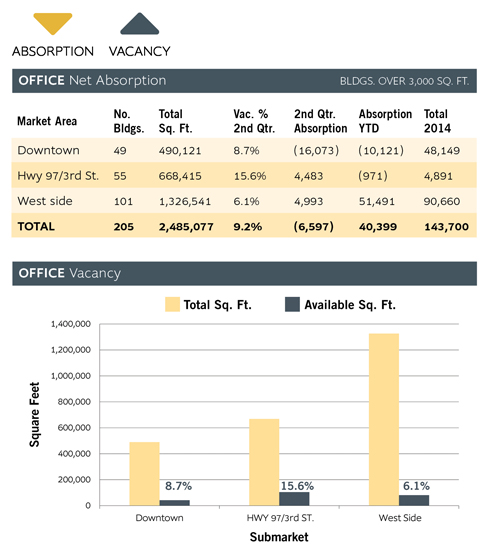 Compass Commercial surveyed 205 buildings for the Q2 office report. The buildings in the sample totaled over 2.48 million square feet. A total negative
absorption of 6,600 sq. ft. recorded during the second quarter. The citywide office vacancy rate increased slightly from 8.9% to 9.2% as a result. There is now 227,500 sq. ft. of available space for lease. The negative absorption recorded in the second quarter is the first quarter in the last 12 that has not been positive.
The downtown submarket experienced 16,000 sq. ft. of negative net absorption during the second quarter. This result relates to the relocation of Karnopp Peterson from downtown to the Old Mill District. There is currently 17,500 sq. ft. available in the three-story building at 1201 NW Wall Street. Downtown’s office vacancy rate now stands at 8.7% — up from 5.39% at the end of Q1.
The highway 97/3rd Street corridor recorded 4,500 sq. ft. of positive net absorption in Q2. Twelve buildings reported positive absorption and two reported negative absorption for the quarter. Mosaic Medical vacated 409 NE Greenwood Avenue and erased most of the positive absorption. The vacancy rate for the submarket decreased from 16.4% to 15.6%.
The west side submarket recorded 5,000 sq. ft. of positive net absorption. Twenty-one buildings reported a change during Q2. Of those, 60% had a decrease in vacancy. The vacancy rate dropped to 6.1% from 6.5% as a result.
Bend Retail Market
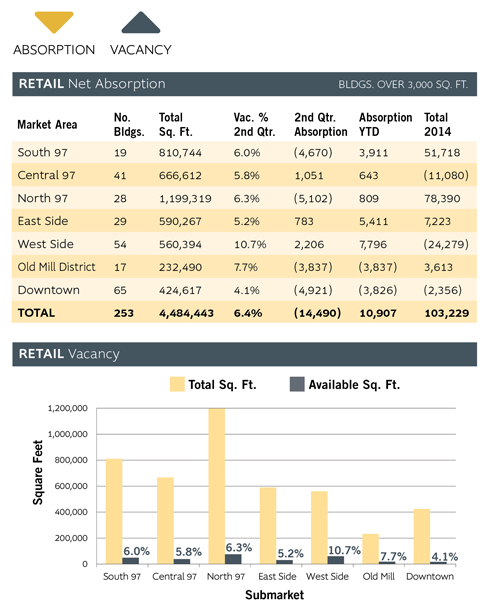
Compass Commercial surveyed 253 retail buildings totaling nearly 4,485,000 square feet for the second quarter 2015 retail report. The citywide vacancy
increased from 6.1% in Q1 to 6.4% at the end of Q2 due to 14,500 sq. ft. of negative net absorption. During the last five quarters, this is first time space vacancy has exceeded space leased.
Four out of the seven retail submarkets in Bend recorded negative net absorption over the past 90 days. Fortunately, nothing too dramatic took place and the
overall impact on the market was negligible.
The west side submarket performed the best during the quarter with 2,200 sq. ft. of positive absorption. The vacancy rate for this area is now 10.7%. It is important to note that only seven of the 64 buildings surveyed had any vacancy and that the former Ray’s Food Place makes up about 75% of the total. The north 97 corridor showed the least positive results with 5,100 sq. ft. of negative absorption tallied in this submarket during the second quarter. Again, some perspective is required. Just six of the 28 properties surveyed reported any vacancy. The quarter started with a 5.8% vacancy rate and ended at 6.3%.
Industrial Market
 BEND
BEND
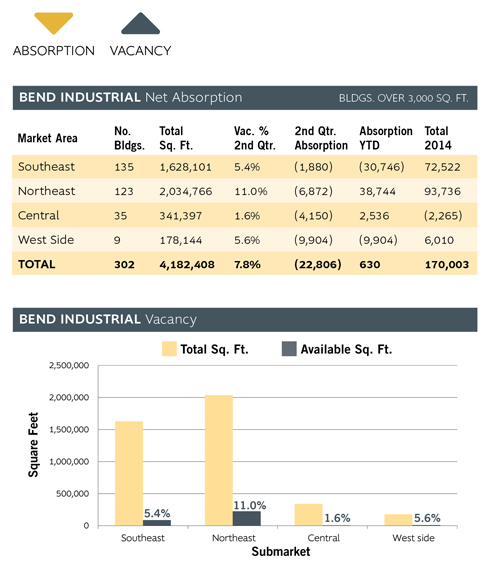
Compass Commercial surveyed 302 buildings for the second quarter industrial report. The buildings in the sample totaled over 4.18 million square feet. There was 22,800 sq. ft. of negative net absorption over the last 90 days. The citywide industrial vacancy rate increased from 6.6% to 7.8%. There is roughly 327,000 sq. ft. of available space for lease.
The southeast submarket recorded nearly 1,900 sq. ft. of negative net absorption in the second quarter. Seven buildings reported changes and five of those had decreased vacancy. Unfortunately, the other two suffered more vacancy. Just ten of the 135 buildings surveyed have any vacancy. The vacancy rate increased from 4.8% to 5.4% due to the new vacancies.
The northeast submarket recorded almost 6,900 sq. ft. of negative net absorption in Q2. Five buildings reported negative absorption and two reported positive absorption. The vacancy rate rose from 9.8% to 11.0% as a result. Just 13 of the 123 buildings surveyed have any vacancy.
The central submarket recorded just under 4,200 sq. ft. of negative net absorption with just one space leased during Q2 and another that became available. The new 5,400 sq. ft. vacancy is the only available space in this submarket. The vacancy rate is now 1.6%.
Of the west side’s nine buildings that make up the 178,000 sq. ft. submarket, just one building is available for lease at this time. It is a 9,900 sq. ft. metal warehouse adjacent to the Old Mill Marketplace on Industrial Way. The vacancy rate for this submarket is now 5.6%.
REDMOND
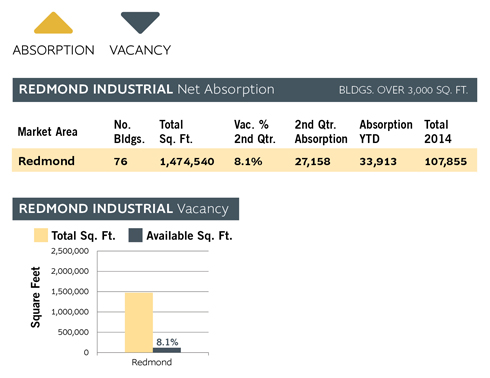
Redmond’s 1.47 million square foot industrial market is nearly back to equilibrium. Over 27,000 sq. ft. of positive absorption took place in Q2, including a 9,000
sq. ft. lease at 1789 SW Veterans Way. The eight years of double-digit vacancy has come to a halt as Q1’s rate of 10% dropped to 8.1%. Of 120,000 sq. ft. that remains available, a minority are small spaces. Large blocks make up the bulk of the vacancy.