By the Compass Points Editorial Team
![]()
Every city in Oregon is required to have a 20-year supply of land for housing and employment in their Urban Growth Boundary (UGB). State law requires that a city demonstrate the need for additional land (e.g. for housing, industrial development) before expanding their UGB. This “demonstration of need” must also show that the land currently inside the UGB cannot reasonably accommodate the 20-year supply. The City of Bend is nearing approval of its final Urban Growth Boundary scenario — a two-year process — scheduled to end April 2016.
The new scenario proposes to bring approximately 2,000 acres into the UGB and aims to address a variety of specific
technical issues and planning requirements established by the Oregon Land Conservation and Development Commission (LCDC) in
the remand following the previously proposed plan. Key objectives outlined for the revised proposal are to use land, public
infrastructure, and resources more efficiently by concentrating on urban density and encouraging development to promote
greater sustainability.
With our third quarter report showing continued positive net absorption across all product types, and Bend’s citywide
vacancy down, or unchanged as reported in the retail market, adopting an adequate plan to accommodate 20-years of projected
growth is critical. Whether 2,000 acres is enough to accommodate the increased demand for land and infrastructure for new
businesses and homes, or if the proposed scenarios for redevelopment will satisfy the LCDC’s requirements is still in
debate, but the City intends to complete local adoption of the amended UGB by April 2016 to complete the remand process by
the end of next year.
In Q3, Bend’s citywide office vacancy rate decreased substantially from 9.2% to 7.4% with 32,721 square feet of space
absorbed, continuing a three year trend of decreased vacancy in the office market.
The citywide retail market vacancy recorded 10,516 sq. ft. of positive absorption, but the vacancy rate remained unchanged
at 6.4% at the end of Q3, due to a few building size corrections. The west side submarket’s higher 9.3% retail vacancy
remains elevated due to 43,000 sq. ft. of space still available in Westside Village shopping center.
The Bend industrial market remains strong with citywide vacancy continuing to decline. In Q3, industrial vacancy dropped to
6.3% from Q2’s 7.8%. The northeast submarket recorded the strongest gain with 50,744 sq. ft. of absorption, moving the
vacancy from Q2’s 11% to 8.5% in Q3.
Bend Office Market
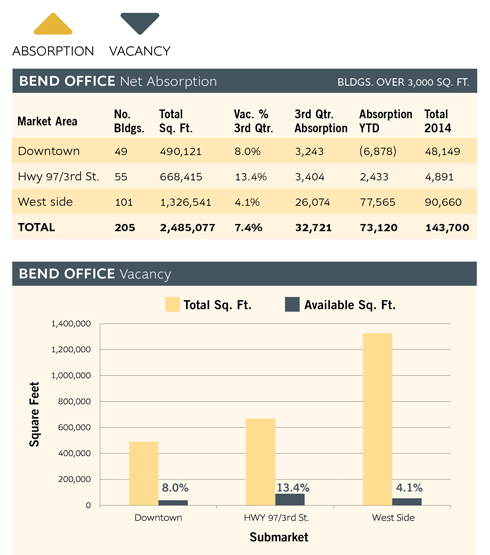 Compass Commercial surveyed 205 buildings for the Q3 office report. The buildings in the sample totaled over 2.48 million square feet. A total positive absorption of 32,721 sq. ft. was recorded during the third quarter. The citywide office vacancy rate decreased substantially from 9.2% to 7.4% as a result. There is now just over 183,000 sq. ft. available for lease, down from 227,500 sq. ft. in Q2. The positive absorption recorded in the quarter reversed the one quarter blip of negative absorption and continued the downward trend of vacancy for 12 of the last 13 quarters, dating back to Q2 2012, when the vacancy stood at a worrisome 21.9%.
The downtown submarket recorded 3,243 sq. ft. of positive net absorption during the third quarter. There is currently 39,316 sq. ft. available downtown. The office vacancy rate now stands at 8.0%, down from 8.7% at the end of Q2. Six buildings reported positive absorption, and three recorded negative absorption in the quarter. The biggest gainer was a 3,956 sq. ft. lease in the remodeled former High Lakes Health Care building at 18 NW Oregon Ave., which filled the 8,000 sq. ft. building to 100% occupancy.
The highway 97/3rd St. corridor recorded 3,404 sq. ft. of positive net absorption in Q3, even though eight buildings reported negative absorption compared to six reporting positive absorption. This was due in part to a 9,500 sq. ft. lease at Empire Corporate Park to Red Jacket West, formerly known as Choose Growth. The vacancy rate for the submarket decreased from 15.6% to 13.4%.
The west side submarket recorded a healthy 26,074 sq. ft. of positive net absorption, continuing the five-quarter trend of strong occupancy. Fourteen buildings reported positive change and eight were negative. The largest lease was to Price, Fronk and Company, a CPA firm, that leased over 8,500 sq. ft. in the former American Licorice building in NorthWest Crossing. The vacancy rate dropped to 4.1% from 6.1% as a result.
Bend Retail Market
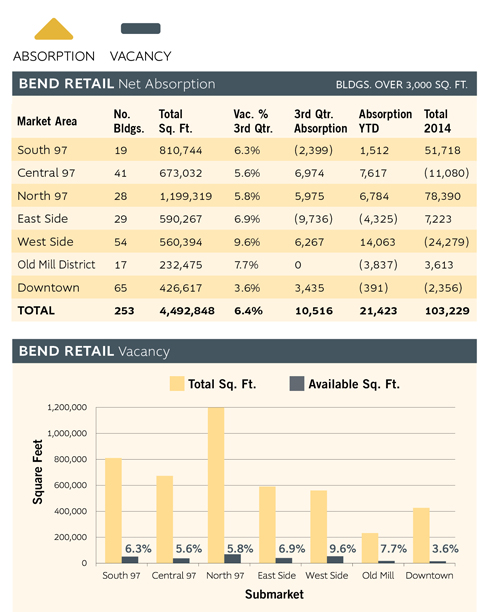
Compass Commercial surveyed 253 retail buildings totaling over 4,492,000 square feet for the third quarter 2015 report. The citywide vacancy remained statistically unchanged at 6.4% at the end of Q3, even though there was nearly 11,000 sq. ft. of positive absorption recorded, due to some building size corrections on the survey.
Four out of the seven retail submarkets in Bend recorded positive net absorption, two were negative and one remained unchanged in Q3. The central and north 97 submarkets, along with the west side submarket each recorded over 6,000 sq. ft. of positive net absorption, topping the survey results.
The downtown retail area remained the strongest submarket with 3.6% vacancy, while the west side remained the highest at 9.6%, due to the still vacant 43,000 sq. ft. Ray’s Food Place building in Westside Village shopping center. The east side corridor was the biggest loser, with 9,736 sq. ft. of negative absorption tallied in this submarket during the third quarter. The other submarket losing occupancy was the south 97 area which lost 2,400 sq. ft. while the Old Mill District remained unchanged with no net change in activity and a 7.7% vacancy rate.
Industrial Market
 BEND
BEND
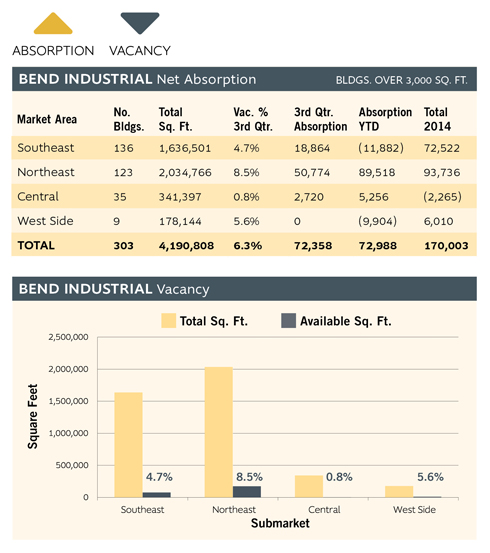
Compass Commercial surveyed 303 buildings for the third quarter industrial report. The buildings in the sample totaled 4.19 million square feet. There was a healthy 72,358 sq. ft. of positive net absorption over the last 90 days. The citywide industrial vacancy rate decreased as a result from 7.8% to 6.3%. There is now just over 263,000 sq. ft. of available space for lease.
Three of the four submarkets recorded positive absorption, while the smallest west side submarket remained unchanged at 5.6% with no activity and only one 9,900 sq. ft. space available.
The northeast submarket again recorded the strongest activity, with 50,774 sq. ft. of positive absorption noted, dropping the vacancy rate from 11.0% in Q2 to 8.5% at the end of Q3. Several notable leases took place in the quarter, including Element 1’s occupancy of the 14,274 sq. ft. former PMI Building on Plateau Dr., 11,000 sq. ft. was absorbed in the newly remodeled Murray Road Industrial Center (formerly Fuqua Homes), and nearly 25,000 sq. ft. was leased in the former U.S. Allegiance space on 18th St. by In the Breeze, a kite distributor and import company.
The southeast submarket recorded 18,864 sq. ft. of positive net absorption in the third quarter. Seven buildings reported changes with just two reporting negative net absorption. The vacancy rate decreased as a result from 5.4% to 4.7%.
The central submarket recorded just under 2,720 sq. ft. of positive net absorption with one space leased and one vacated during Q3 resulting in a vacancy rate of only 0.8%, down from 1.6% at the end of Q2.
REDMOND
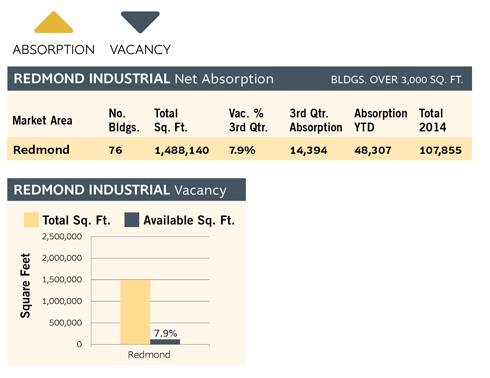
We can safely say that Redmond’s 1.49 million square foot industrial market is back to a healthy state. Another 14,394 sq. ft. were absorbed in Q3, following Q2’s 27,158 sq. ft. of positive absorption. This is the sixth consecutive quarter recording positive results, and 11th out of 13 of the last quarters that saw decreased vacancies. As a result, Q3’s rate of vacancy dropped to 7.9%, down from 8.1% at the end of Q2. Just 118,000 sq. ft. remains available, down from the peak in Q2 2011 of over 434,000 sq. ft.. Seven buildings recorded positive absorption while only one lost ground.