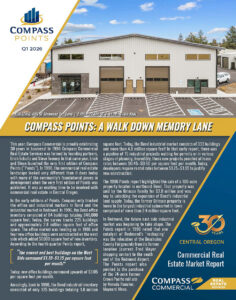
Compass Points: A Walk Down Memory Lane
Written by partner and broker Graham Dent
This year, Compass Commercial is proudly celebrating 30 years in business! In 1996 Compass Commercial Real Estate Services was formed by founding partners, Erich Schultz and Steve Toomey. In that same year, Erich and Steve launched the very first edition of Compass Points (“Points”). In 1996, the commercial real estate landscape looked very different than it does today with many of the community’s foundational pieces in development when the very first edition of Points was published. It was an exciting time to be involved with commercial real estate in Central Oregon.
In the early editions of Points, Compass only tracked the office and industrial markets in Bend and the industrial market in Redmond. In 1996, the Bend office inventory consisted of 84 buildings totaling 840,000 square feet. Today, the survey tracks 225 buildings and approximately 2.8 million square feet of office space. The office market was heating up in 1996 and four new office buildings were constructed on the west side which added 57,000 square feet of new inventory. According to the fourth quarter Points report,“the newest and best buildings on the West Side command $1.10–$1.15 per square foot per month.” Today, new office buildings command upwards of $3.05 per square foot per month.
Amazingly, back in 1996, the Bend industrial inventory consisted of only 125 buildings totaling 1.8 million square feet. Today, the Bend industrial market consists of 333 buildings and more than 4.8 million square feet! In that early report, there was a pipeline of 15 industrial projects waiting for permits or in various stages of planning. Incredibly, those new projects penciled at lease rates between $0.45–$0.50 per square foot per month. Today, developers require rental rates between $1.75–$1.95 to justify new construction.
The 1996 Points report highlighted the sale of a 100-acre property located in northeast Bend. That property was sold by the Brinson Family for $2.8 million and was key to unlocking the expansion of Bend’s industrial land supply. Today, the former Brinson property is home to the largest industrial submarket in town comprised of more than 2.4 million square feet.
In Redmond, the future east side industrial market was beginning to take shape. The Points report in 1996 noted that one catalyst of Redmond’s ‘reshaping’ was the relocation of the Deschutes County Fairgrounds from its former location (current Fred Meyer shopping center) to the south end of the Redmond Airport. The Points report also pointed to the purchase of the 74-acre former Crown Pacific mill site by Nevada Rancher, Maynard Alves. Since then, this site has provided much of the land supply for Redmond’s industrial expansion including the new distribution hub for Amazon. In 1996, the Points survey for Redmond only consisted of 19 buildings totaling 320,000 square feet! Today, Points tracks a total of 97 buildings and 1.85 million square feet.
Although Points did not track retail data until years later, the 1996 report did note that Bend’s retail market was exploding: “On the west side of town, The Old Mill District at River Bend started designs on the 60,000 SF first phase of its retail component (now called The Shops at the Old Mill District). At the north end of town, the Bend Center and High Desert Village (now Cascade Village Shopping Center) were unveiled. Located on 45 acres adjacent to Target, these developments could consist of over 350,000 SF of space. Home Depot and Waremart (now WinCo) are two possible tenants. Plans on the east side call for the addition of several national retailers including Barnes & Noble, Pier 1, Office Max, Blockbuster, McDonalds, Taco Bell and Burger King. These retailers will be spread along Highway 20 at the Forum and Crossroads retail centers.”
When the first edition of Points was released, Bend was entering a new era of retail demand and beginning to attract national brands and big box stores. However, the locals weren’t embracing this new era.“The general citizenry seems to be up in arms over the appearance and character of the developments being created for these retailers. Many are unimaginative concrete block buildings nestled in a sea of asphalt,” quoted the 1996 Points report. Another highlight in the 1996 report was the groundbreaking for the Original Pancake House at the corner of Colorado and Century Drive. Who knows how many pancakes have been flipped in there since then.
Bend was also establishing itself as a viable alternative for outside investors during this time. The Points report mentioned this increasing demand and that stabilized investment properties were trading at cap rates between 9–10%. Those rates seem high compared to cap rates today, which are generally between 6.5%–7.5% but the cost of debt was substantially higher in 1996, with mortgage rates averaging 7.8% that year.
It’s been a wild ride, but for the last 30 years, Points has been a consistent resource for our clients and the business community in Central Oregon and beyond. Thanks to the foresight of Erich and Steve and all the hard work by Compass brokers through the years, we have access to a reliable data source that has been invaluable to our clients and an integral piece in their decision making.
Bend Office Market
Compass Commercial surveyed 225 office buildings totaling 2.79 million square feet for the Q1 2026 report. During the quarter, the market experienced negative absorption of 3,194 SF. With this latest data, the Bend office market has now recorded negative absorption in five of the past six quarters. The vacancy rate increased slightly to 7.05% in Q1 2026, up from 6.94% in Q4 2025 and 6.05% in Q1 2025. Available sublease space increased slightly from 49,695 SF in Q4 to 50,524 SF in Q1, resulting in an overall availability rate of 8.75%. This gradual increase in available space continues to provide tenants with more options, particularly in second-generation office product.
LEASING: Leasing activity remains sluggish across all segments of the office market. The Downtown and Hwy 97/3rd St. submarkets both experienced modest negative absorption of 1,589 SF and 3,091 SF, respectively. The West Side submarket rebounded from a difficult Q4 (25,013 SF of negative absorption) and recorded 1,486 SF of positive absorption in Q1.
RENTS: Lease rates remain flat with the high end of the market ranging from $2.00–$3.15/SF/Mo. NNN and more affordable space ranging from $1.40–$2.00/SF/Mo. NNN.
CONSTRUCTION: No speculative office buildings are currently under construction in Bend.
SALES: Office sales activity was limited but included two notable transactions during the quarter. A 1,245 SF single-tenant building at 846 NW Colorado Ave. sold in February for $800,000, or $643/SF, to an owner-user. Additionally, a 10,685 SF building located at 2100 NE Wyatt Ct. sold in March for $3,450,000, or $323/SF, with Deschutes County as the buyer. These transactions highlight continued interest from both owner-users and public entities, even as broader market conditions remain more challenging.
Written by partner and broker Jay Lyons, SIOR, CCIM
Bend Retail
Compass Commercial surveyed over 4.61 million square feet of retail space across 275 buildings in Bend to compile our first quarter 2026 report. In the first quarter of the year, Bend experienced a slight increase in overall vacancy, rising from 4.32% in Q4 2025 to 4.37% in Q1 2026.
LEASING: The retail vacancy rate on Bend’s West Side continued to decrease for the third consecutive quarter, reaching 4.51%. The Old Mill District maintained a 0% vacancy rate, while the Downtown submarket also showed no change in its 0.34% vacancy rate from Q4. Bend’s Central district recorded 3,485 SF of negative absorption, causing its vacancy rate to jump from 5.78% to 6.29%. The East Side submarket also experienced a slight rise in vacancy, reaching 9.35%.
RENTS: Asking rental rates in Bend range from $1.00–$3.75/SF/Mo. NNN, with an average of $2.20/SF/Mo. NNN. Exceptions to this range include several drive-thru pad sites being marketed for lease between $5.00–$5.42/SF/Mo.
CONSTRUCTION: A new restaurant drive-thru building at 3600 N Highway 97 is set to break ground in Q2 2026. Additionally, Goodwill’s new superstore on the north side of Bend officially opened its doors in Q1 2026, bringing an estimated 50 new jobs to the Central Oregon community.
SALES: Notable sales this quarter included a sale-leaseback of the 195,916 SF Fred Meyer–anchored Paulina Square shopping center. Fred Meyer Inc. originally purchased the property for $21.97 million, or $111.73/SF in January 2026 and executed a sale-leaseback later that same month at the same price. 2570–2680 NE Twin Knolls Dr. sold for $5,250,000, representing a 6.5% cap rate and $206.14/SF. A 3,020 SF retail building at 1255 NE 3rd St. sold in February for $975,000, or $322.85/SF. Additionally, 631 NE Federal St. in Bend sold for $2,040,000, reflecting a 5.08% cap rate and $406.78/SF.
Written by broker Eli Harrison
Bend Industrial
Compass Commercial surveyed 333 industrial buildings in Bend totaling 4.81 million square feet for the Q1 2026 report. The market experienced 5,049 SF of positive absorption during the quarter, resulting in an overall vacancy rate of 3.36%. Bend currently has 161,654 SF of industrial space available, reflecting continued tight market conditions.
LEASING: Leasing activity remained relatively stagnant during the quarter, as evidenced by the modest level of absorption. The Northeast industrial submarket experienced the greatest level of activity, where a total of 13,465 SF of new leasing occurred during the period.
RENTS: The average asking lease rate for raw industrial space was $1.13/SF/Mo. NNN at the end of Q1, slightly higher than the $1.11/SF/Mo. NNN recorded in Q4 2025. Asking lease rates for new construction range from $1.75–$1.95/SF/Mo. NNN, depending on delivery condition. Second-generation flex space and highly\improved industrial space are typically leasing in the $1.50–$1.65/SF/Mo. NNN range.
CONSTRUCTION: Taylor Brooks is currently underway on the construction of NOCO at Juniper Ridge, located at Cooley Rd. and NE 18th St. The first phase consists of three industrial/flex buildings totaling 62,429 SF, with completion expected in 2026. The Falcon industrial condo project, located at 20489 NE Funner Pl., is nearing completion. The project consists of a range of condo units for sale (approximately 1,440 SF to 2,200 SF) and is projected to be completed in 2026.
SALES: One notable sale occurred during Q1 2026. The warehouse building located at 355 NE 2nd St. (adjacent to Bi-Mart building) sold to a non-profit owner-user for $1,800,000, or $84.21/SF.
Written by partner and broker Graham Dent, SIOR
Redmond Industrial
Compass Commercial surveyed 99 industrial buildings in Redmond totaling approximately 1.86 million square feet for the Q1 2026 report. For the second consecutive quarter, the market experienced negative absorption, contributing to an increase in vacancy from 6.21% to 7.26%. This represents the highest vacancy rate since Q2 2015; however, the increase is largely attributed to several larger spaces coming to market, rather than a significant decline in overall demand.
LEASING: Leasing activity in Q1 remained measured, with continued tenant interest in smaller-bay industrial spaces under 5,000 SF. Consistent tenant inquiries and touring activity suggest underlying demand remains intact, particularly within the small- to mid-size user segment.
RENTS: Industrial asking rents in Q1 2026 ranged from approximately $0.75/SF/Mo. NNN on the lower end to $1.20/SF/Mo. NNN for specialty-use or first-generation space, reflecting a slight widening in pricing based on building quality and level of improvements.
CONSTRUCTION: With the exception of 501 Veterans Way and the Red Barn Industrial Center, new industrial construction remains limited, and the market continues to be driven primarily by existing inventory. The lack of speculative development continues to limit new supply, which may help stabilize vacancy and support rental rates over time.
Written by broker Kristie Schmitt, CCIM
To view the complete report with vacancy and absorption graphs, notable transactions and imagery, sign up to receive our quarterly publication at https://www.compasscommercial.com/POINTS or call (541) 383-2444.