 NAVIGATING COMMERCIAL PROPERTY MANAGEMENT
Written by VP of Asset & Property Management Russ Monroe, CPM®, CSM
One of the many decisions to make when purchasing commercial real estate is how to handle management. Considering the full depth of what property management means can make the difference in retaining your tenants and cash flow and commanding a market rental rate. Professional property management saves owners time, maximizes their investments, and protects them from undue liability.
RISK MANAGEMENT, SECURITY & INSURANCE
Effective risk management, including security measures and insurance coverage, is essential to building ownership. Each commercial property is unique and requires a specialized approach to establish adequate protections for building owners, occupants, and visitors. Owners must stay current on regulatory compliance, maintain insurance to meet lender requirements, and consider security risks related to potential liability and exposure. A property manager will conduct site surveys and inspections to warrant timely repairs and assess safety measures such as lighting, locks and keys, and surveillance. Establishing relationships with local law enforcement and employing security guards contribute to a comprehensive risk management strategy.
ACCOUNTING & FINANCIAL REPORTING
Managing the financial health of commercial properties is crucial. This involves proper administration of operating expenses and Common Area Maintenance (CAM) charges for Triple Net (NNN) leases. Property managers will review property accounting statements, tie-out monthly financials, prepare budgets, and provide year-end financial reporting to ensure transparency and accountability to stakeholders. Property management firms often employ in-house accountants who can do more heavy lifting to reduce reliance on CPAs and save the owner money.
LEASE ADMINISTRATION
Proper lease administration is fundamental to maximizing your building’s financial and operating strategy. It entails interpreting leases and contracts, managing tenant renewals, and ensuring compliance with lease obligations. Improper lease administration can negatively impact tenant retention, impacting a property’s bottom line. When done correctly, lease administration can ensure that costs are allocated back to tenants through CAM charges when the lease allows – minimizing a building owner’s overhead while maximizing their profit.
PHYSICAL FACILITIES MANAGEMENT
Professional management of physical facilities ensures properties are well-maintained, enhancing their appeal to tenants and preserving their long-term value. A property manager will create a multi-year capital improvement plan while budgeting for routine service, maintenance, and repairs throughout the year. These buildings command higher rents and attract quality tenants, while creating a comfortable environment for tenants and their visitors.
While self-management may seem feasible for some property owners, the complexities and responsibilities frequently outweigh the benefits. The deciding factor often comes down to the owner’s capacity versus the capabilities of a reputable management organization. Professional property management offers expertise, efficiency, and peace of mind, ensuring your commercial properties are well-maintained, financially optimized, and compliant with regulatory requirements.
Compass Commercial is the largest commercial property management company and the only Accredited Management Organization (AMO) in Central Oregon. If you are considering professional property management for your commercial building in Oregon, contact us today.
BEND OFFICE MARKET
Written by partner and broker Jay Lyons, SIOR, CCIM
Compass Commercial surveyed 227 office buildings totaling 2.80 million square feet for the first quarter office report of 2024. The market experienced 6,484 SF of negative absorption in Q1 which resulted in a modest increase in vacancy rate from 5.66% in Q4 of 2023 to 6.18% in Q1. This is the fifth consecutive quarter with negative absorption and increased vacancy. The amount of available sublease space decreased for the second consecutive quarter going from 57,963 SF in Q4 to 49,838 SF in Q1. Unfortunately, the reduction in sublease space was offset by the negative absorption resulting in a Q1 availability rate of 7.96%.
LEASING: Leasing demand remains slow across all submarkets and suite sizes. The West Side submarket took the biggest hit in Q4 with 7,460 SF of negative absorption. The Hwy 97/3rd Street submarket experienced 1,986 SF of negative absorption while the Downtown submarket experienced 2,962 SF of positive absorption.
RENTS: Lease rates remain flat with the high end of the market ranging from $2.00 to $3.05/SF/Mo. NNN and more affordable space ranging from $1.40 to $2.00/SF/Mo. NNN. Rate reductions continue to be more of the exception than the rule.
CONSTRUCTION: No speculative offices buildings are under construction this quarter.
SALES: There were two notable sales this quarter. An investor purchased the 13,655 SF office/flex building at 150 NE Hawthorne Avenue. The building sold for $3 million or approximately $220/SF. An owner user also purchased a 2,182 SF, single tenant office building located at 135 NW Greeley Avenue. The building sold for $785,000 or approximately $360/SF.
BEND RETAIL MARKET
Written by broker Eli Harrison
Compass Commercial surveyed over 4.64 million square feet of retail space across 269 buildings in Bend to compile the first quarter retail report of 2024. After experiencing an uptick in vacancy at the end of 2023, the retail market in Bend rebounding with a decrease in overall vacancy from 3.10% in Q4 of 2023 down to 2.88% in Q1 of this year. There is now 133,775 SF of available retail space for lease in Bend.
LEASING: The positive absorption recorded in the North 97 submarket is due to one 7,000 SF lease at 63011 N Highway 97, dropping the vacancy rate to 0.79%. The Central 97 submarket also experienced a rebound to start the year, with 3,007 SF of positive absorption leading to new a vacancy rate of 3.22%. No leasing activity took place in the East Side, West Side or Old Mill District, though a new property was added to the West Side survey resulting in an increase in vacancy to 3.87% . The East Side vacancy rate remained unchanged at 3.77% and the Old Mill District maintained its 0% vacancy rate for the third quarter in a row. The West Side and Downtown were the only submarkets to experience small increases in overall vacancy.
RENTS: The asking rental rates for Bend retail space continue to hold steady between $1.40 and $4.58/SF/Mo. NNN, with the highest rates associated with drive-thru sites and new construction.
CONSTRUCTION: Vertical construction continues to progress for The Jackstraw, a new mixed-use complex next to the Box Factory. This project will feature 313 high-end residential units and 16,976 SF of ground floor retail space. The shell is on schedule to be completed in the fall of 2025. The new development at 515 SW Century Drive featuring a 129-unit apartment complex and an adjacent 1,625 SF retail building is on track to be completed in the fall of 2024.
SALES: A retail building at 61343 South Highway 97 sold for $2 million, or $347.89/SF. Rockin’ Dave’s Bistro at 661 NE Greenwood Avenue sold in March for $1.25 million, or $520.83/SF. In Tumalo, 64678 Cook Avenue sold for $875,000, or $407.55.
BEND INDUSTRIAL MARKET
Written by Partner and broker Graham Dent, SIOR
Compass Commercial surveyed 322 Bend industrial buildings totaling 4.66 million square feet for the first quarter of 2024. The market experienced 686 SF of negative absorption during the quarter resulting in an overall vacancy rate of 2.00%, essentially unchanged from the 1.99% recorded in Q4 2023. There is now 93,314 SF of industrial space currently available in Bend.
LEASING: With the exception of a few smaller industrial leases completed during the quarter, leasing activity was limited as evidenced by a vacancy rate that remained virtually unchanged from the prior quarter. Despite the slowdown in overall leasing activity, the market remains extremely tight, particularly for space under 3,000 SF.
RENTS: The average asking lease rate for standard industrial space was $1.06/SF/Mo. at the end of Q1 2024, a negligible difference from last quarter’s rate of $1.05/SF/Mo. There are a handful of highly specialized industrial/flex spaces commanding between $1.25 and $1.50/SF/Mo. NNN.
CONSTRUCTION: In Bend, there is one speculative industrial project underway at the corner of SE Wilson Avenue and SE 9th Street, known as the Midway project. It consists of three buildings, one of which will be occupied by Blackstrap. The remaining two flex buildings totaling 27,789 SF will be delivered in spring 2025. Taylor Brooks is also nearing a groundbreaking on their 44,200 SF concrete tilt up industrial building in Juniper Ridge. That speculative project is expected to be completed by the summer 2025.
SALES: A handful of industrial properties traded during the quarter. Most notably, the property located at 20798 High Desert Lane sold for $3,500,000 or $260/SF to an owner user and the property located 62885 Mercury Place sold for $2,500,000 or $167/SF also to an owner user. The costs of construction and construction financing remain high, and more frequently than not, prohibitive to build. Therefore, owner users are purchasing existing buildings and modifying them as needed to suit their needs.
REDMOND INDUSTRIAL MARKET
Written by Partner and broker Pat Kesgard, CCIM
Compass Commercial surveyed 92 buildings totaling 1.76 million square feet for the first quarter Redmond industrial market report of 2024. The Redmond industrial market experienced 21,894 SF of negative absorption resulting in the vacancy rate increasing from 1.13% in Q4 2023 to 2.59% in Q1 2024. There is now 45,565 SF of available space.
LEASING: Demand for space in the Redmond industrial market remains strong with tenants seeking spaces between 1,500 SF and 5,000 SF. Three new industrial buildings totaling over 13,000 SF were added to the survey in Q1 with a majority of the space already leased leaving just 4,000 SF left for lease. Although 21,894 SF of industrial space came back online in Q1, 2,376 SF of space was leased at The Beacon, an industrial complex located at 2605 SW 1st Street, during the quarter.
RENTS: Lease rates in the Redmond industrial market continue to increase slightly at the top of the market. Average asking rates are between $0.90 and $1.25/SF/Mo. NNN depending on the condition and size of the space. Asking rates for new projects under construction are between $1.10 and $1.25/SF/Mo. NNN.
CONSTRUCTION: Construction on the new Red Barn Industrial Center comprised of 13,208 SF was completed in Q1. There continues to be between 20,000 SF to 50,000 SF of industrial space in the pipeline, including a 23,400 SF industrial building on NE Jackpine Court slated for completion in summer 2024. There continues to be a significant amount of square footage that is being built as owner user buildings.
*Positive Absorption = Space Leased | Negative Absorption = Space Vacated
MULTIFAMILY REPORT | REGIONAL VIEW
Written by broker Ron Ross
Real estate markets are localized, and the focus of this newsletter is Central Oregon. But there is a regional connection. Understanding the broader perspective can be interesting and instructive.
This chart tells a different story than is often reported in the media and touted by politicians. The annual rent growth for the last 12 months regionally has ranged from negative 1.0% to positive 3.3%. Seven of the nine regions were less than 2.0%. Right now, in Bend, there are over 500 apartment units available for rent.
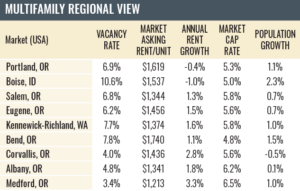 The data on the Bend market encompasses the entire Deschutes County, so it will be referred to as Central Oregon. That data confirms that Central Oregon has the highest rents in the region. It also has the second highest vacancy rate behind Boise and has the lowest market cap rate in the region.
Central Oregon has the highest population growth rate in the state but lags Boise’s explosive growth. Central Oregon growth has slowed substantially to about half of what it was at its peak during the COVID years. Thus far, Central Oregon is absorbing new units with minor concessions being offered. One month of free rent is common. Property managers are optimistic that spring will bring increased positive lease up activity.
There remains a huge pipeline of new units coming online in the next year or two. This will likely keep rents flat and bump up vacancies a bit. Good news for renters. But vacancies should remain manageable for landlords and developers.
Oregon leads the nation in statewide rent control legislation. The law was just amended to cap rents at a maximum 10% increase. According to CoStar, “However, even if rent increases are further restricted, the Bend area’s historical average annual rent growth performance trends to 2.9%. Therefore, it appears an organically growing construction pipeline is likely a more outsized deterrent to rent growth than legislative initiatives.”
INSURANCE ALERT
In light of prevailing challenges within the insurance landscape, property owners must be proactive. Escalating occurrences and severity of natural disasters, coupled with soaring construction costs, crime, and a litigious environment pose significant hurdles for insurers. Consequently, consumers are experiencing unprecedented rate hikes, diminished coverage, elevated deductibles, and even the prospect of insurance unavailability. Older properties are the most at risk. Budget for rate increases and work with your insurer to implement risk mitigation strategies such as fire prevention and infrastructure maintenance and upgrades.
About Compass Points Market Report
Compass Points is Central Oregon’s premier commercial real estate newsletter. Compass Commercial Real Estate Services offers comprehensive surveys of office, retail and industrial properties in Bend and Redmond, Oregon. The report provides a detailed look at quarterly vacancy and absorption data in these markets along with leasing and sales activity, rental rates, construction projects and more.
To view the complete report with vacancy and absorption graphs, notable transactions and imagery, sign up to receive our quarterly publication at https://www.compasscommercial.com/POINTS or call (541) 383-2444.